Real engineering, played in a browser.
A web-based renewable-energy simulator built for Vanko Group and RPL Central - calibrated against published industry data, deployed on managed AWS. Live at powerpioneers.net.
Existing renewable-energy simulation tools split into two camps. Professional packages - PLEXOS, EnergyPlus - model the physics rigorously but require paid licences, desktop installs, and specialist training. Browser-based educational tools are accessible but flatten the underlying engineering to the point that the system dynamics no longer resemble real infrastructure.
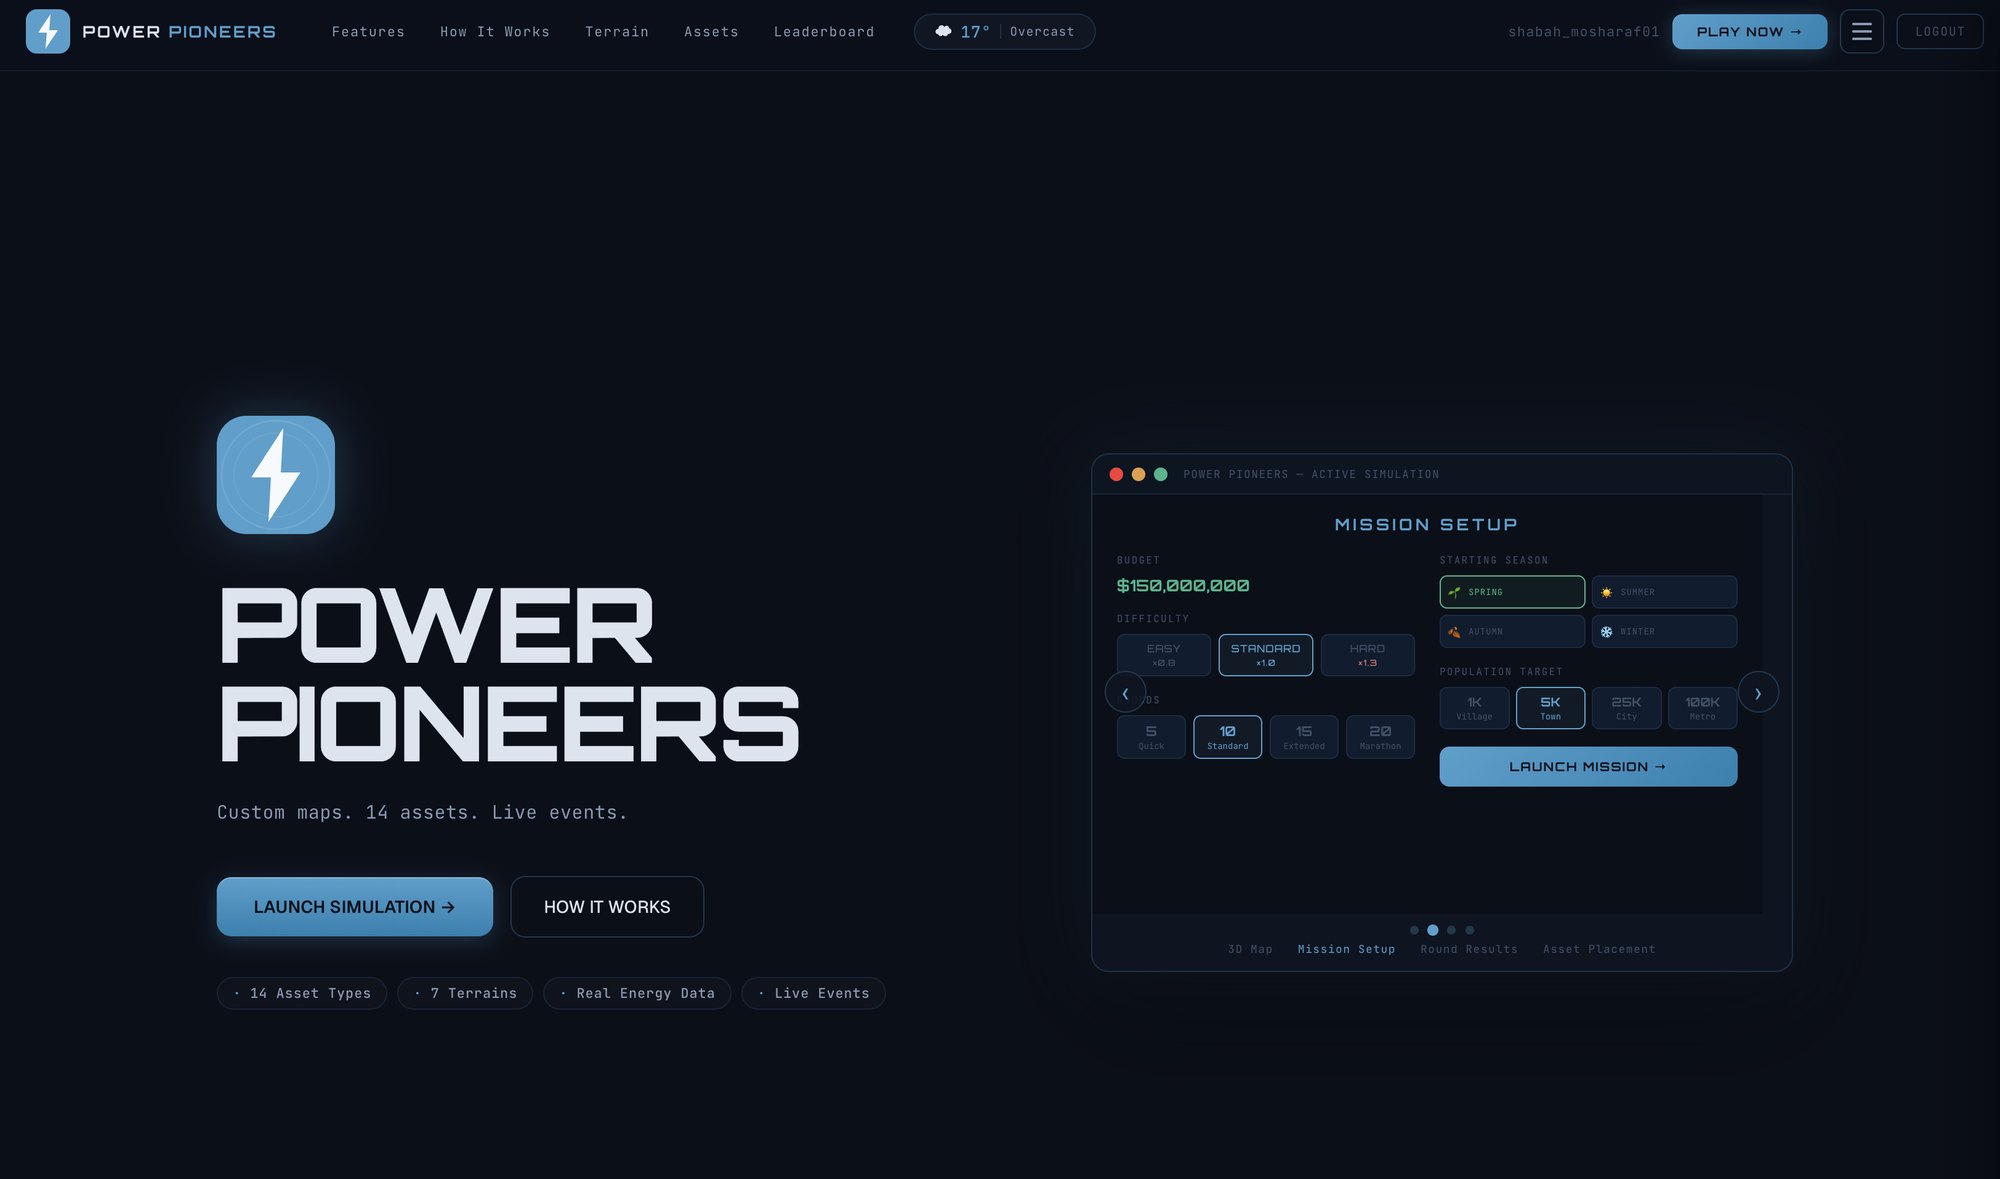
Vanko Group commissioned a third option: a web-based, install-free simulator gamified enough to drive repeated engagement, but grounded in real engineering values. The audience - engineering students, educational institutions, early-career engineers, and Vanko’s own internal teams - needed a tool that could be opened in a browser, run on first contact, and produce results that map back to how the world actually behaves.
Eight one-week sprints, each with a single functional goal: authentication, map and terrain, asset library, simulation engine, events, expanded features, polish and navigation, deployment. The week ran the same shape every time - Monday planning, Tuesday through Thursday heads-down build, Friday integration and review, Friday afternoon or Saturday a demo to the client.
All client communication routed through a single point of contact. Disagreements followed a written-first process - issue raised in the team channel, twenty-four hours for everyone to weigh in, project-manager decision if consensus didn’t land, escalation to the client if scope, timeline, or cost was affected. It absorbed almost all of the friction you’d otherwise hit by week six of a tight build.
The long version of how this project was run lives in a separate essay: How I Run a Software Engineering Project as a Project Lead.
Three tiers. The browser runs the entire frontend in vanilla JavaScript - no framework, no build step, no bundler. The application tier is a Node.js / Express server hosted on AWS Elastic Beanstalk. The data tier is MySQL on RDS, in a private subnet that the application security group is the only thing allowed to reach.
CloudFront fronts the application with HTTPS, a CDN, and AWS WAF for perimeter rate limiting and SQL-injection protection. Route 53 manages DNS for the domain. ACM issues the wildcard certificate.
The original Sprint 8 plan committed considerable time to manually configuring Nginx, PM2, SSL certificate renewal, and environment variables on a bare EC2 instance. The team pivoted to Elastic Beanstalk in the final sprint - same end state, a fraction of the operational surface. It was the highest-leverage decision of the project.
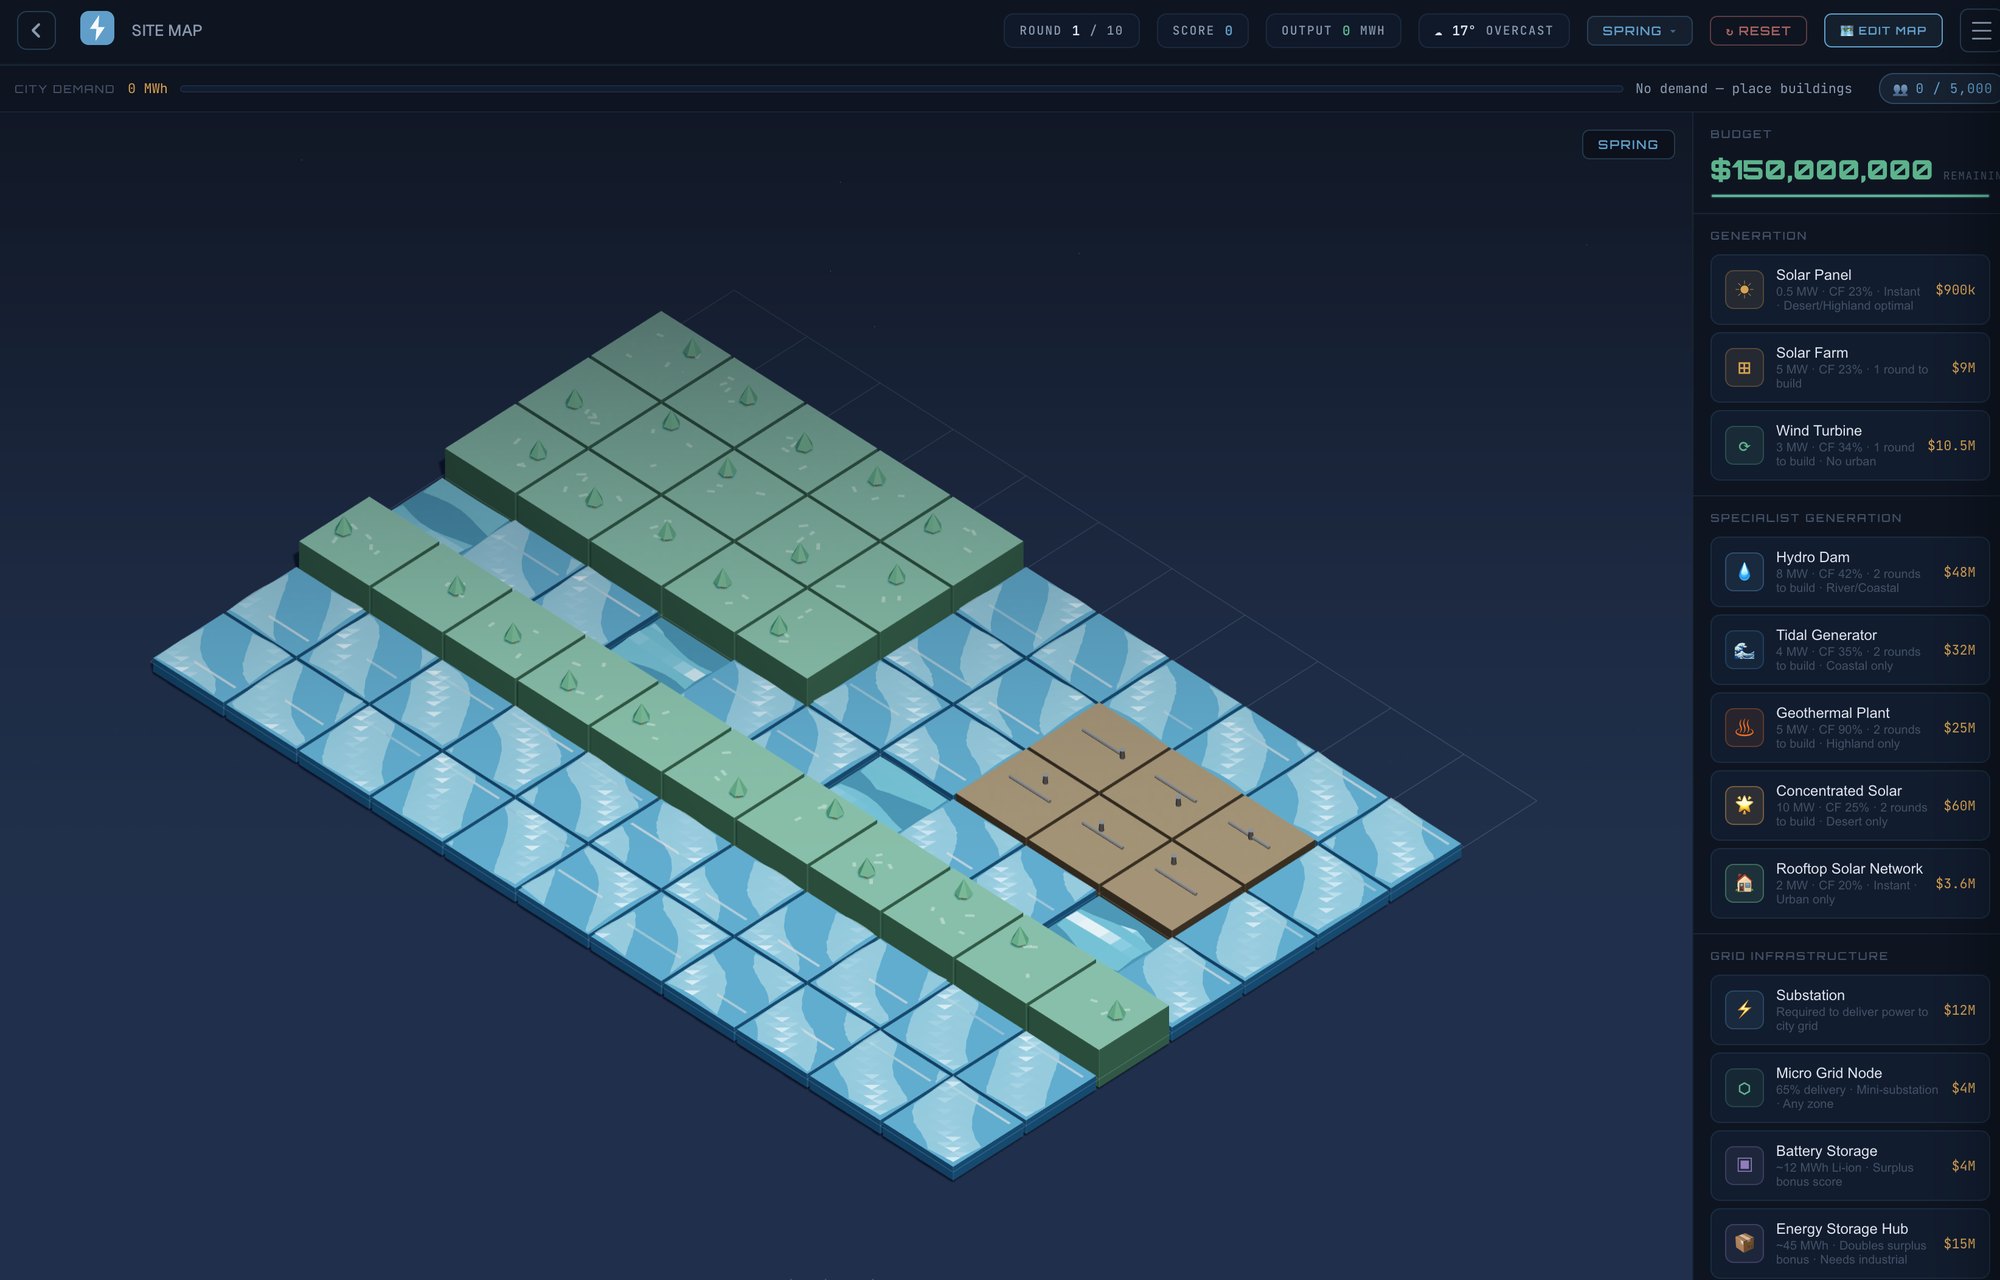
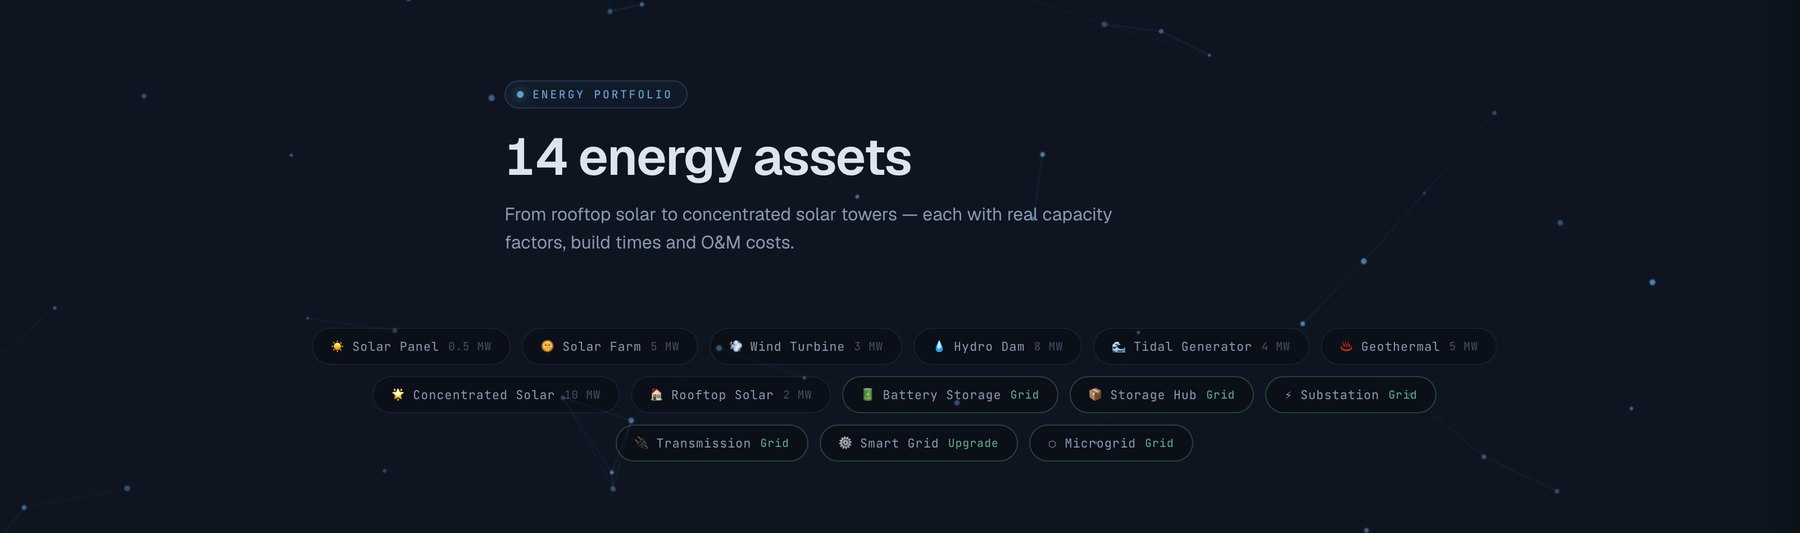
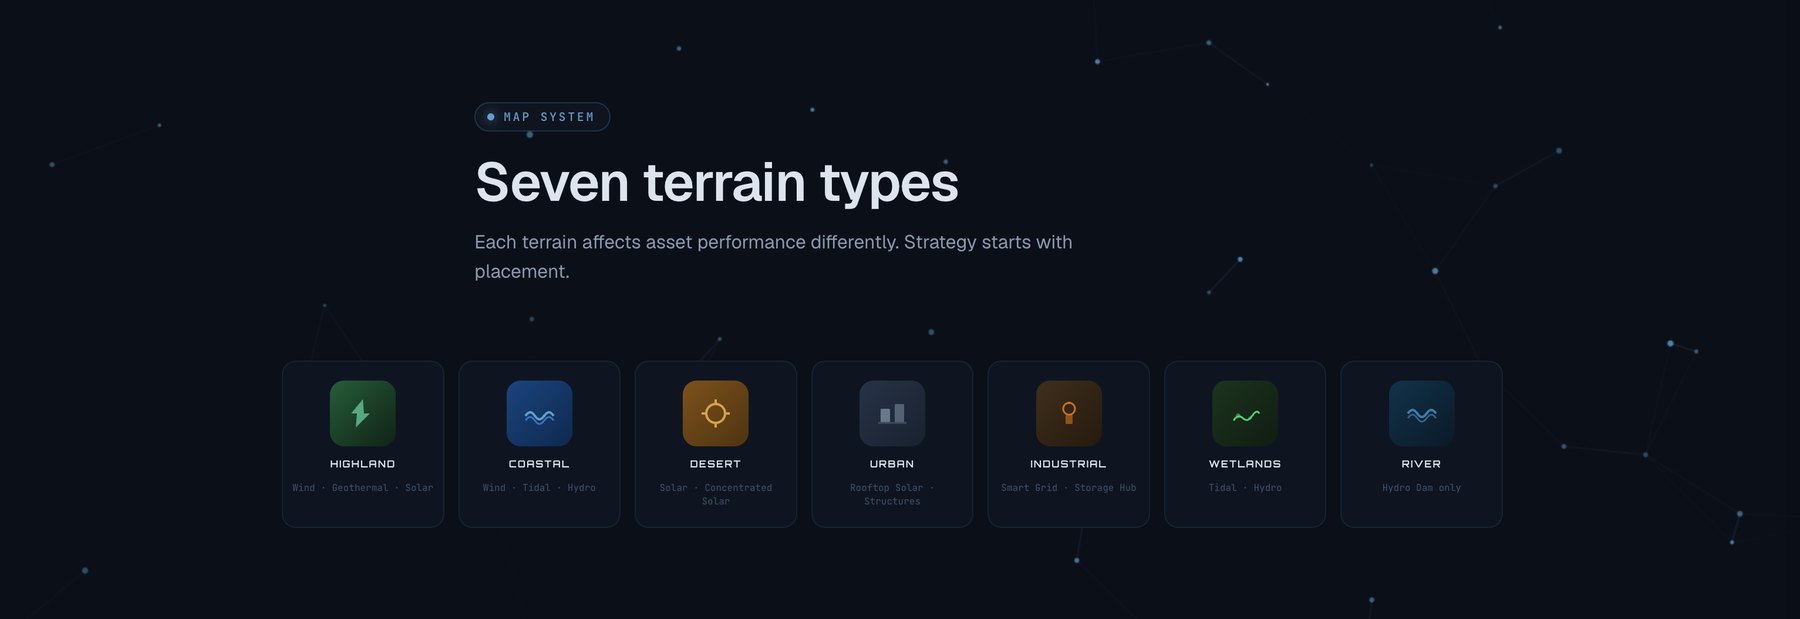
Fourteen generation, grid, and storage assets - solar (panels, farms, rooftop arrays, concentrated solar), wind, hydro, tidal, geothermal - plus the grid infrastructure that gets the power to the load: substations, transmission lines, smart-grid upgrades, battery storage, storage hubs, micro-grid nodes. Players can pick a starter map template or paint terrain tile-by-tile from seven types - coastal, highland, desert, urban, industrial, wetlands, river - each with distinct generation multipliers and placement rules.
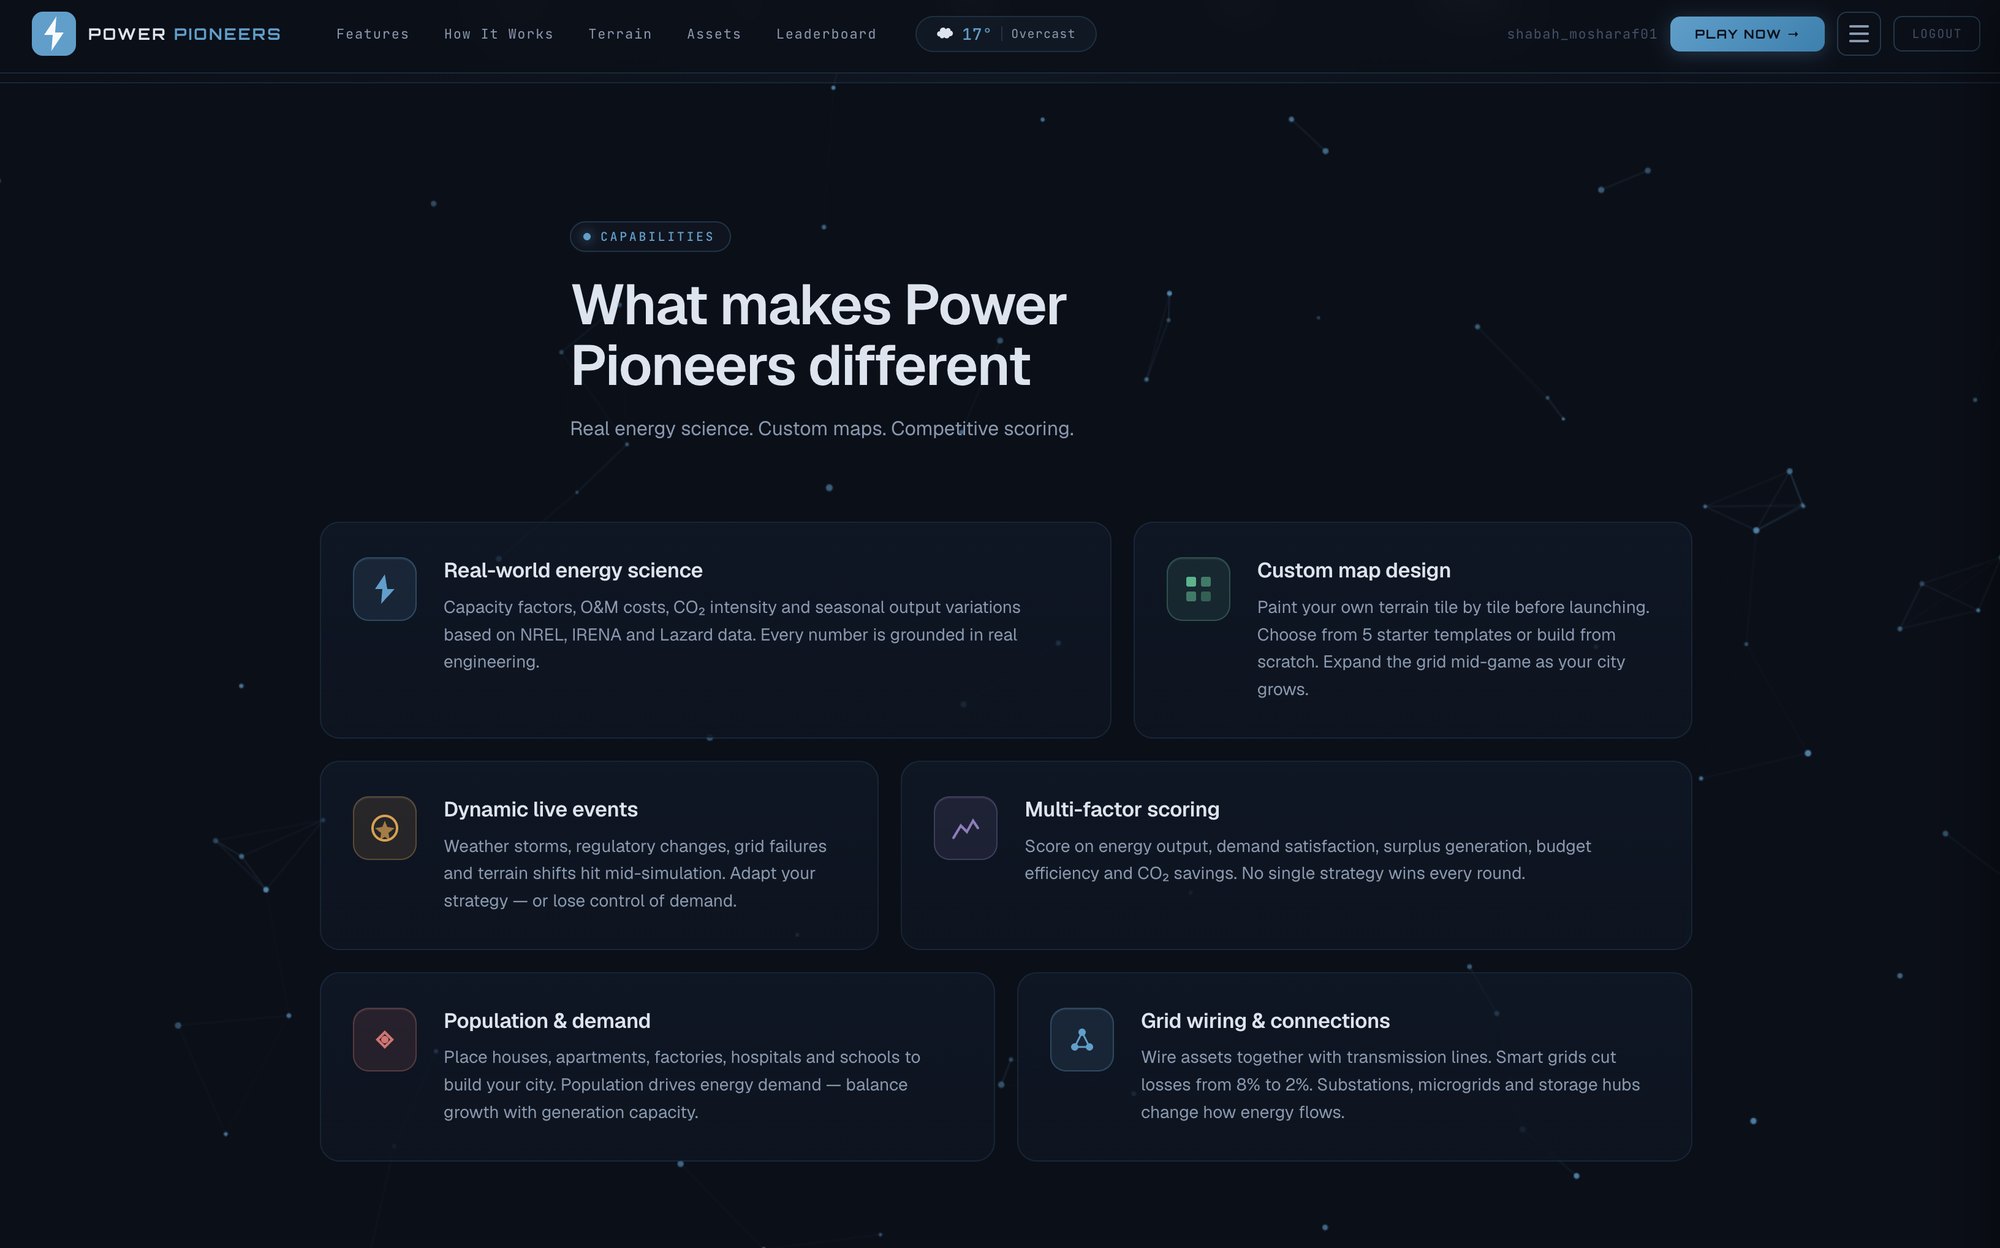
A simulation engine that runs monthly rounds, applying seasonal multipliers, terrain effects, a population-driven demand curve, and stochastic weather and policy events. Calibrated against NREL ATB 2024 for capacity factors, Lazard LCOE+ 2024 and IRENA 2024 for cost data, and IPCC AR6 (2022) for lifecycle CO₂ intensities. A 3 MW wind turbine in the simulation behaves roughly the way a 3 MW wind turbine behaves in the world - same capacity factor, same seasonality, same emissions footprint.
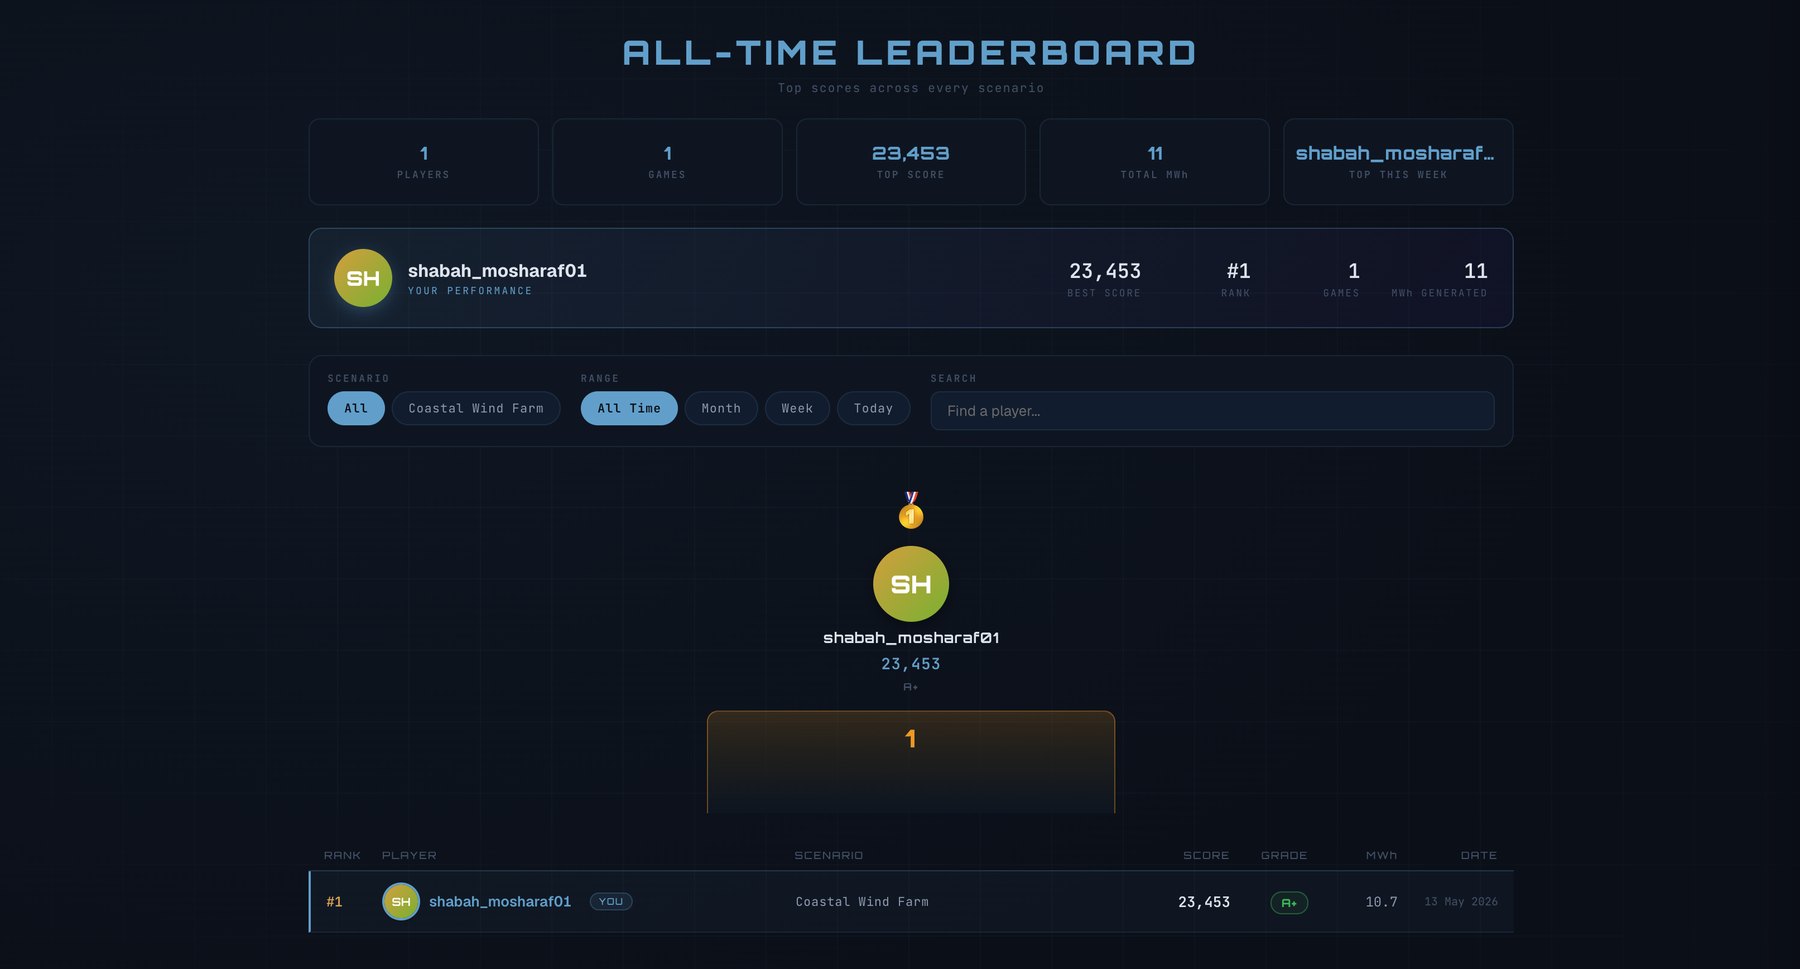
A persistent global leaderboard filterable by scenario, configurable difficulty, build times, scenario modifiers, and a per-round results screen breaking down delivered energy, demand met, capital efficiency, sustainability index, and cumulative CO₂. Each session is graded at completion - A+ to F.
Delivered on schedule and shipped to production. Live at powerpioneers.net with end-to-end HTTPS, MFA-protected AWS accounts, bcrypt-hashed passwords, and the database in a private subnet. The codebase is intentionally compact - three files on the frontend, three on the backend, no build step - which keeps the on-ramp for future engineers short.
The platform is in active use. Further work is now underway on additional mission environments, real-time analytics during gameplay, an administrative dashboard, and LMS integration so the platform can be adopted formally inside university curricula. A React migration sits in the backlog, conditional on the codebase growing past what’s comfortable to maintain in plain JavaScript.